Calibration with saturated images
Info
Please read the calibration page first if you have not already. This page won't make a great deal of sense otherwise.
I have not included a graph for this recipe - it's largely the same as the calibration recipe.
In the calibration recipe page we looked at how to calibrate an image to produce R^\star (reflectance) from DNs or radiance. This requires a calibration target to be present in the image1.
However, some of the patches in the reflection target may be saturated. This data cannot be used for calibration, because it is false - the saturated patches are brighter than the recorded image can show.
Consider the image below:
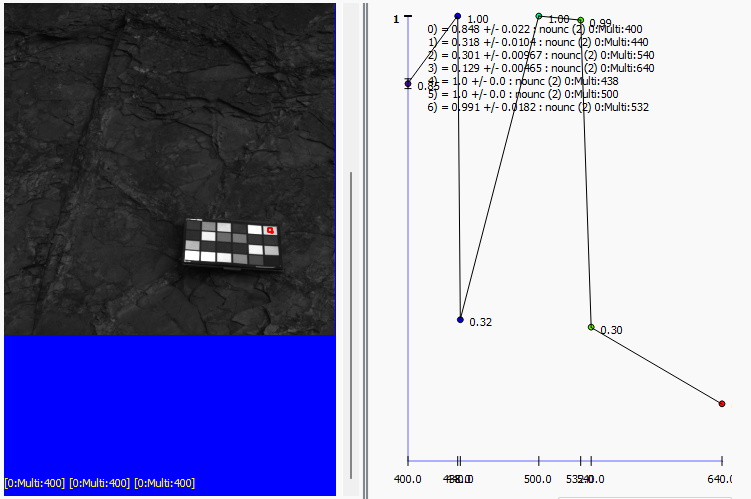
The top-right patch on the ColorChecker target has two saturated bands, shown as "1.00" in the spectrum. In the case of this particular image, it's not saturated in any of the bands which make up the RGB image shown in the canvas, but by visual inspection many other patches are saturated in these bands.
If we try to get reflectance parameters m and c by fitting a line to these points, we end up with this mess:
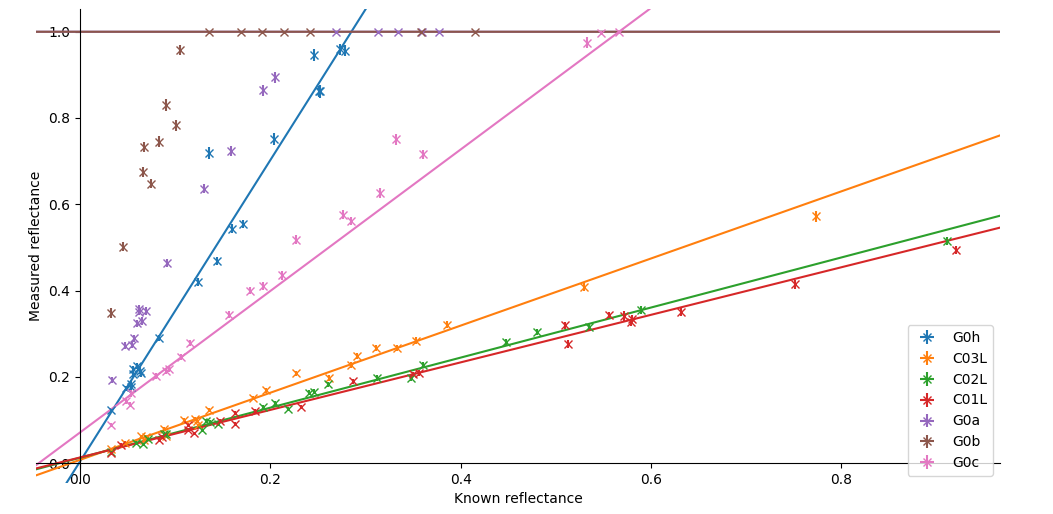
The points for each patch do not fall on a straight line. The saturated points count more in the line fit because they have lower uncertainty, which is particularly bad for the G0a and G0b filters, in which the saturated points dominate so strongly we fit a horizontal line!
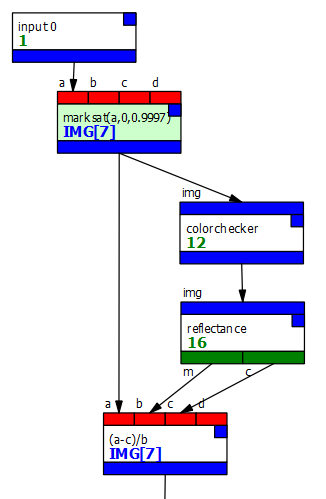
Ideally, the image should be captured again at a shorter exposure time but this is often2 not possible. However, the reflectance patch will ignore pixels which have been marked as saturated. To do this, insert an expr node immediately after the input, and set the expression in that node to
marksat(a,0,0.9997)
The calibration pipeline should look now something like this:
Looking at the reflectance node, we can see the lines fitted to the patches in each band:
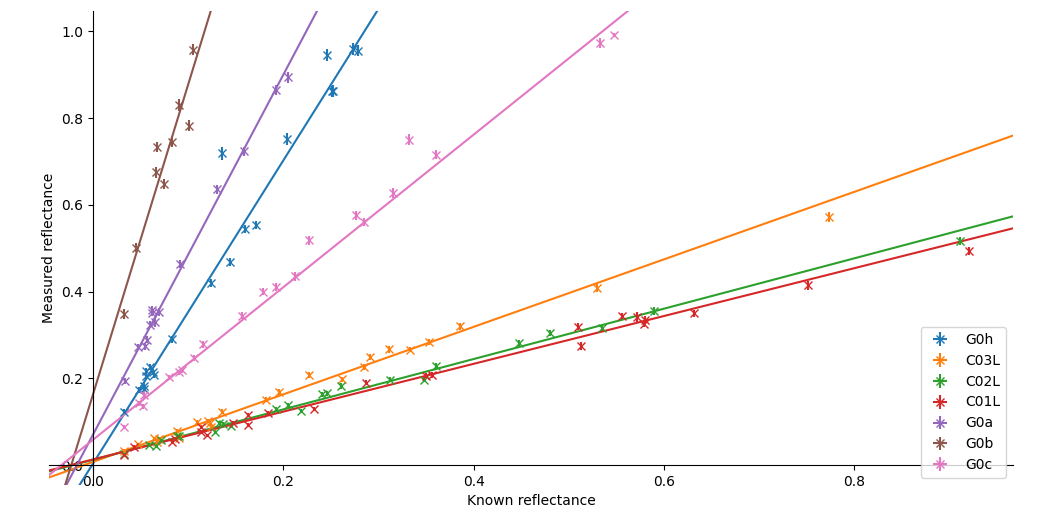
The points are reasonably well aligned for each filter, indicating a good fit.